Data grid
The data grid is the in-browser tabular view of the data behind your overlays and datasets. Open a tabular dataset (for example a Parquet results file) to inspect its objects and markers.
The grid is currently a read-only table showing the objects and markers of the dataset — a straightforward way to review the quantitative data in context with the slide.
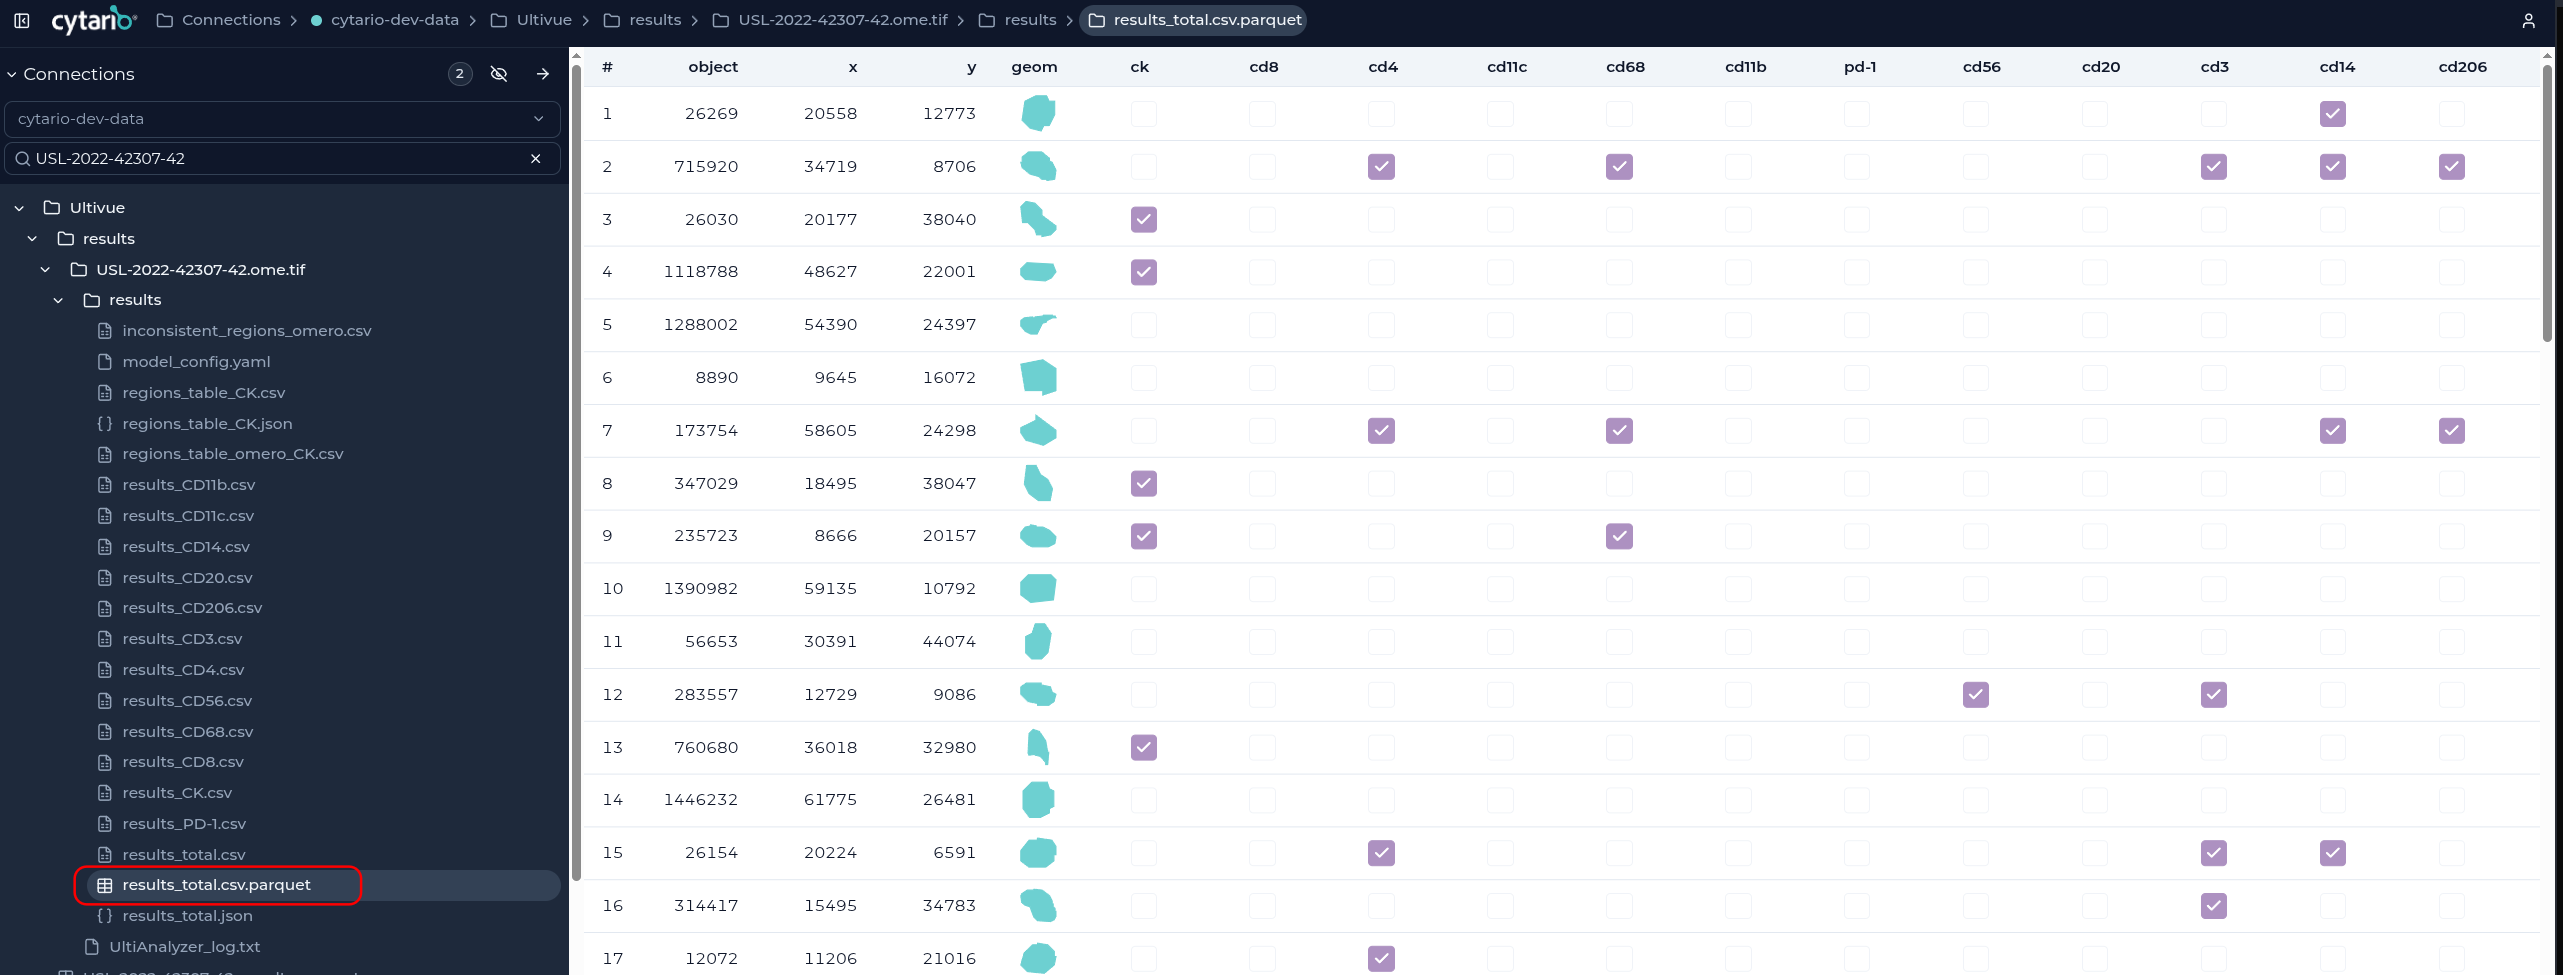
Working with the results
Because the data grid operates on the same datasets that drive overlays, you can move between a spatial view (the overlay on the slide) and a quantitative view (the table) of the same cells, making it easy to relate marker expression to morphology.
See Overlays & quantitative analysis for how to load the data onto a slide.