Overlays & quantitative analysis
Cytario lets you load cell-segmentation overlays onto a slide and query the underlying tabular data — work typically done by technical pathologists and bioinformaticians to quantify biomarkers and co-expression patterns.
Loading an overlay
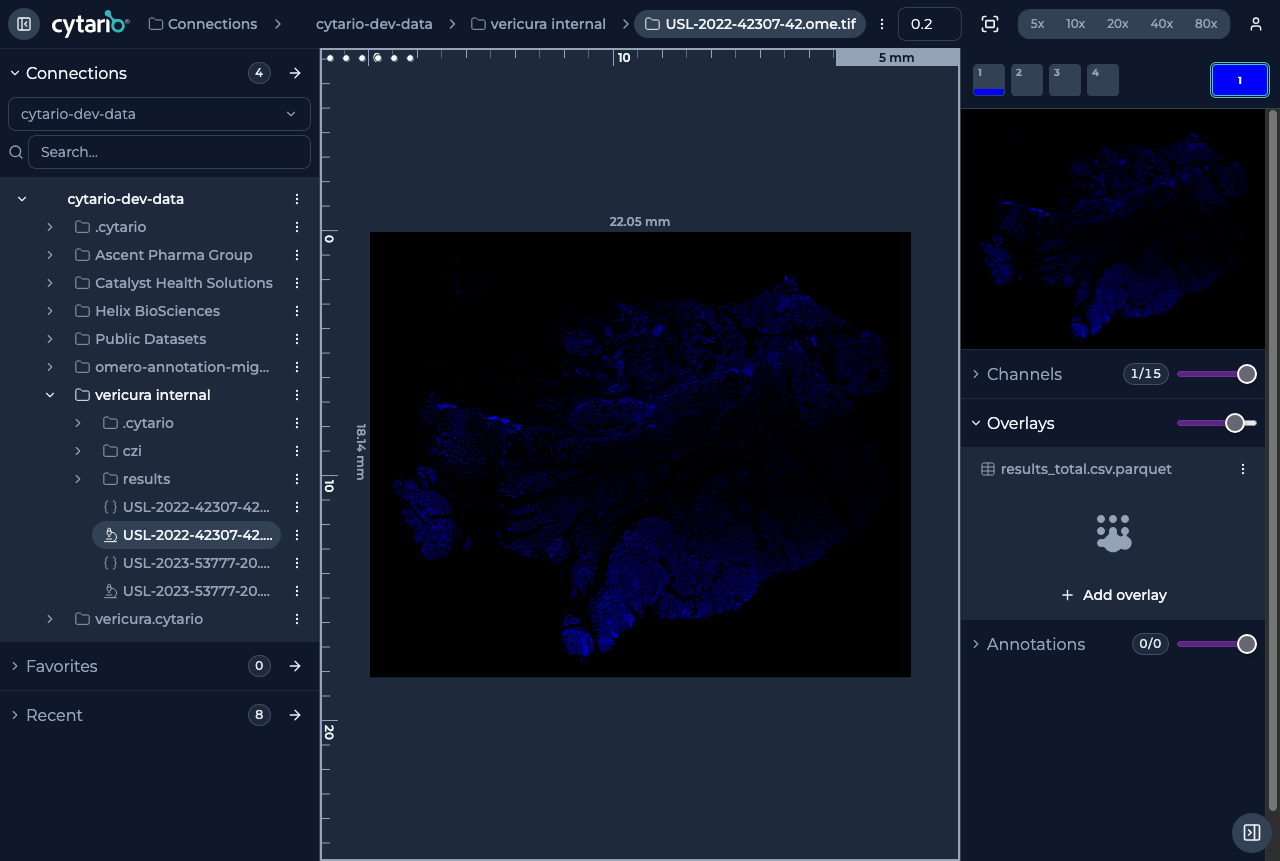
In the Image controls panel, under Overlays, use Add overlay to
attach a Parquet-based cell-segmentation dataset to the image. You pick the
dataset (for example results_total.csv.parquet produced by an analysis run),
and Cytario renders each cell's boundary over the slide.
- Overlay fill opacity controls how prominent the segmentation is. Fills are semi-transparent by default (50%).
- Overlay rendering uses additive blending, so spatial co-localization patterns between markers become visible.
- When you load several overlay datasets, their fills blend where they overlap. For example, assign red to one dataset and yellow to another: cells found by both show as orange, and cells unique to either keep their own color. Complementary pairs (red + cyan, yellow + blue, green + magenta) add up to white, making agreement between datasets unmistakable.
- The same marker loaded from two datasets starts on different colors automatically, so you only recolor when you want to.
What you can do with an overlay
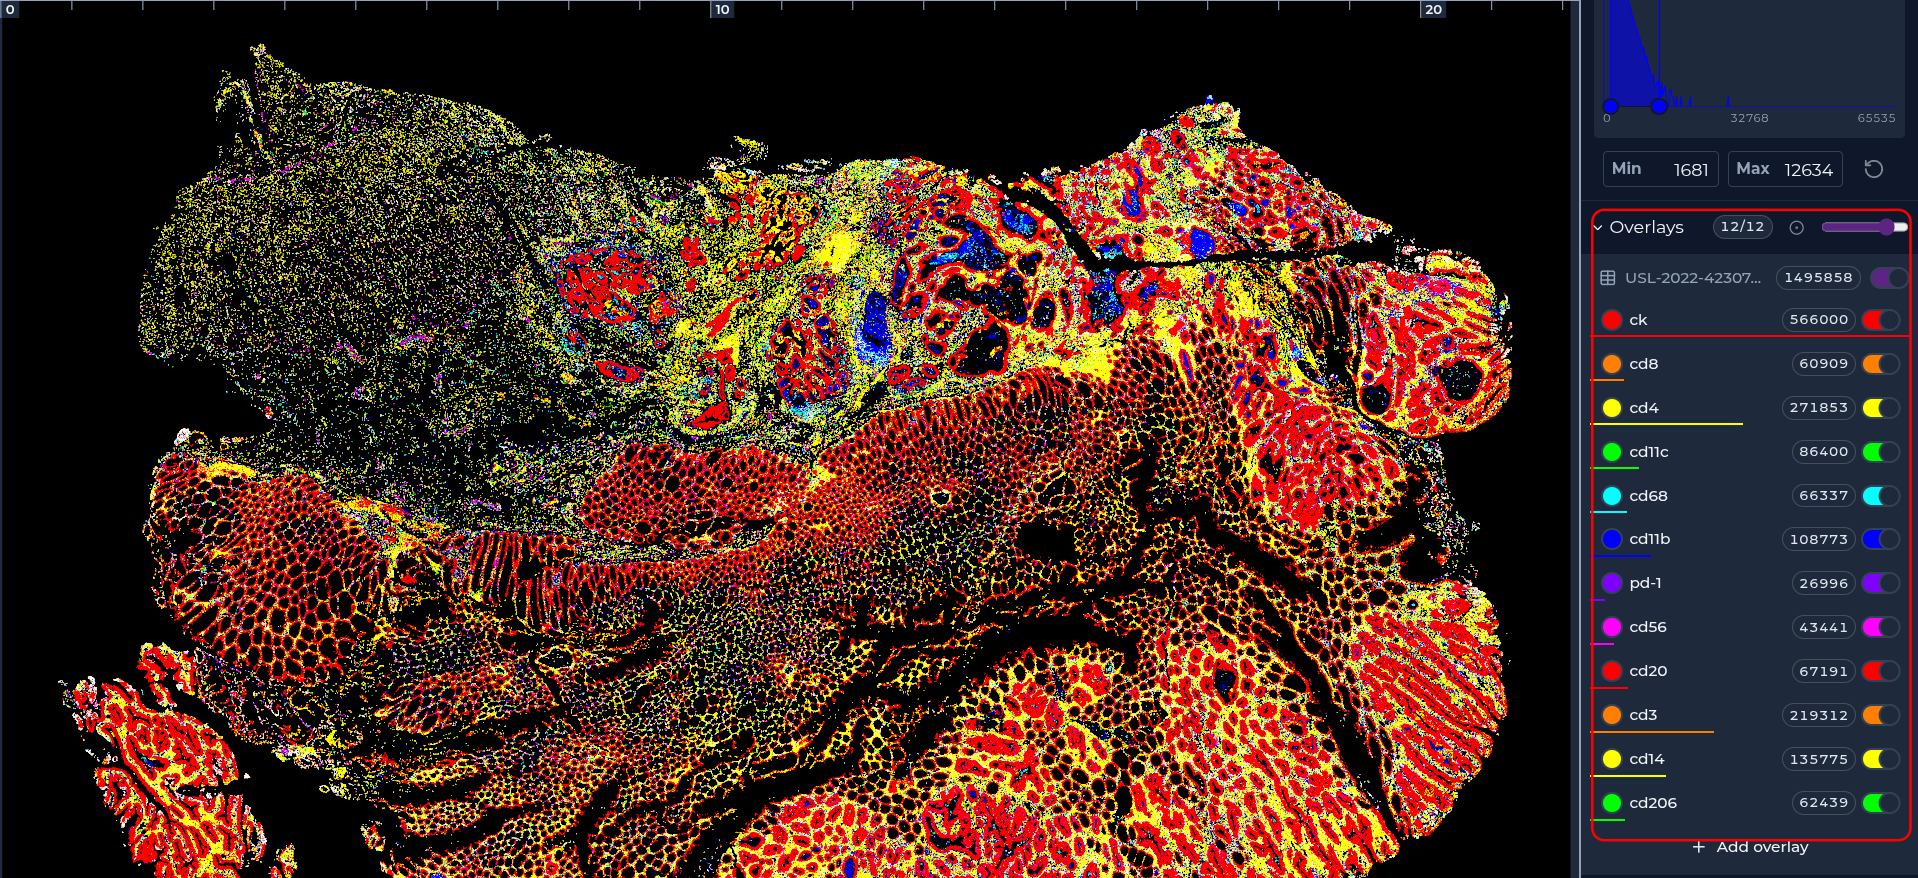
- Visualize per-cell boundaries and marker expression over the tissue.
- Open the underlying tabular data in the data grid to query it (see Data grid).
- Correlate marker co-expression spatially and statistically.
The analysis results
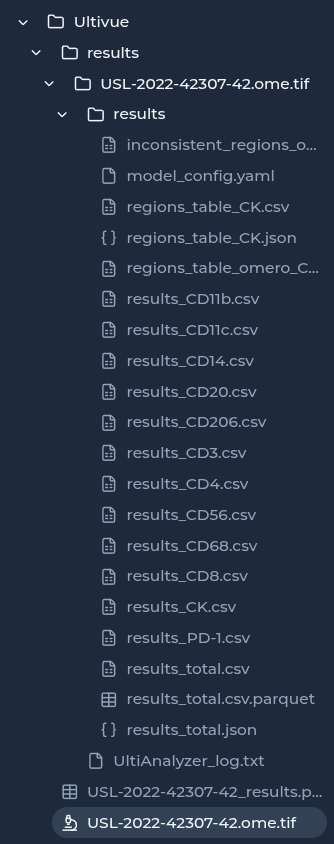
Cytario stores the outputs of image analyses alongside your data (for example
in a results folder). Overlays and their tabular datasets come from there, so
you can revisit quantitative results in context with the original slide.